This exercise is due on Oct 15, 2014.
Download a pdf version of the homework.
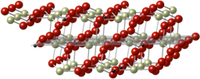
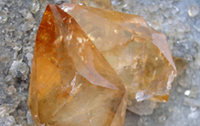
Phase diagrams are commonly and widely used to depict the stability of minerals. Rocks can be though of as chemical systems. The state of the system, that is, the amount and compostions of the minerals in the rock, is “mapped" on a diagram showing temperature, pressure, composition, and any other environmental variables that affect the state. Here is the simple but important example of plagioclase.
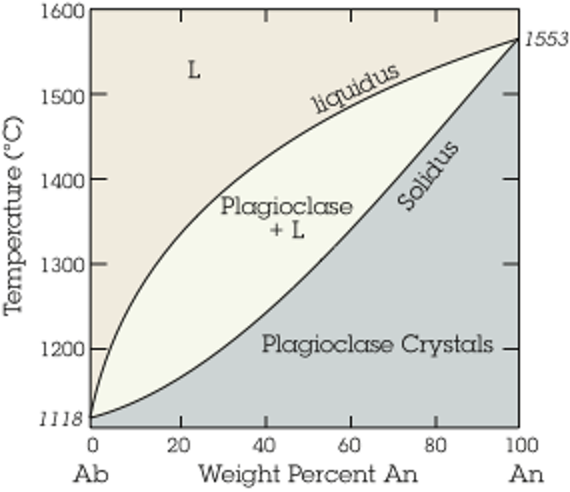
Phases in the two-component system albite–anorthite at 1 atm. The phase diagram was originally determined in 1913 from experiments conducted by N. L. Bowen
Be sure to learn about tie-lines and the lever rule!